You have a collection of reports for the HR department of your company. The datasets use row-level security (RLS). The company has multiple sales regions that each has an HR manager. You need to ensure that the HR managers can interact with the data from their region only. The HR managers must be prevented from changing the layout of the reports. How should you provision access to the reports for the HR managers?
You have the tables shown in the following table.
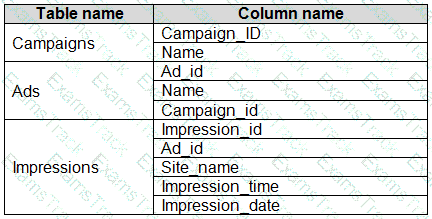
The Impressions table contains approximately 30 million records per month.
You need to create an ad analytics system to meet the following requirements:
Present ad impression counts for the day, campaign, and Site_name. The analytics for the last year are required.
Minimize the data model size.
Which two actions should you perform? Each correct answer presents part of the solution.
NOTE: Each correct selection is worth one point.
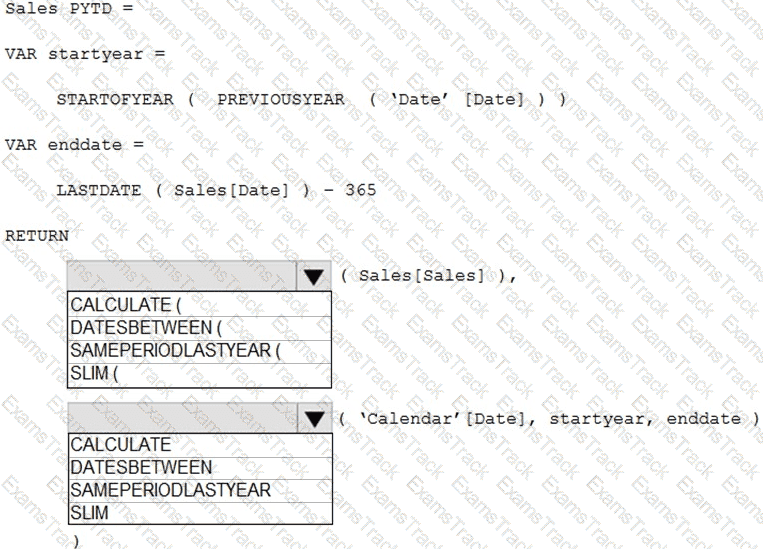
You are enhancing a Power BI model that has DAX calculations.
You need to create a measure that returns the year-to-date total sales from the same date of the previous calendar year.
Which DAX functions should you use? To answer, select the appropriate options in the answer area.
NOTE: Each correct selection is worth one point.
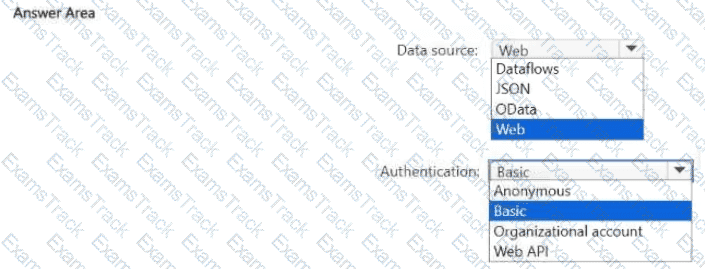
You plan to use Power Query Editor to get data from an API.
The API returns a JSON response.
You have a username and password tor the API.
Which data source and authentication method should you use to connect to the API? To answer, select the appropriate options in the answer area.
NOTE: Each correct selection is worth one point.
You have a Power BI report. The report contains visualizations that have interactions. You need to identify which visualizations take the longest to complete. What should you use?
You need to minimize the size of the semantic model. The solution must meet the report requirements.
What should you do?
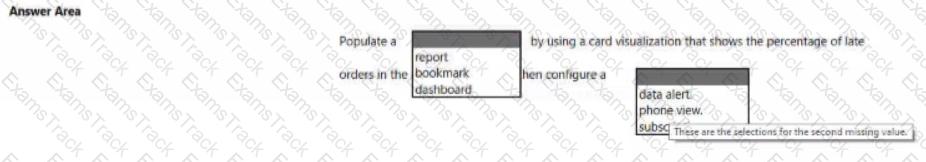
You need to create a solution to meet the notification requirements of the warehouse shipping department.
What should you do? To answer, select the appropriate options in the answer area.
NOTE: Each correct select is worth one point:
You need to minimize me size of the dataset. The solution must meet the report requirements What should you do?
You need to create the semantic model.
Which storage mode should you use for the tables in the semantic model?
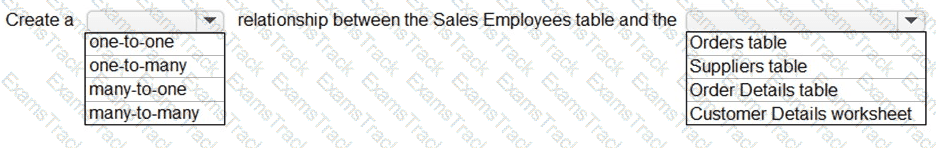
You need to create a relationship in the dataset for RLS.
What should you do? To answer, select the appropriate options in the answer area.
NOTE: Each correct selection is worth one point.
|
PDF + Testing Engine
|
|---|
|
$52.5 |
|
Testing Engine
|
|---|
|
$40.5 |
|
PDF (Q&A)
|
|---|
|
$34.5 |
Microsoft Free Exams |
|---|

|
Copyright © 2026 Examstrack. All Rights Reserved

TESTED 06 Jul 2026


