Note: This question is part of a series of questions that present the same scenario. Each question in the series contains a unique solution that might meet the stated goals. Some question sets might have more than one correct solution, while others might not have a correct solution.
After you answer a question in this section, you will NOT be able to return to it. As a result, these questions will not appear in the review screen.
You are modeling data by using Microsoft Power Bl. Part of the data model is a large Microsoft SQL Server table named Order that has more than 100 million records.
During the development process, you need to import a sample of the data from the Order table.
Solution: You write a DAX expression that uses the FILTER function.
Does this meet the goal?
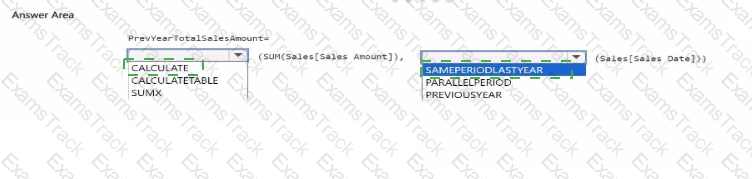
You have a semantic model that contains a table named Sales. The table contains the following columns;
• Order ID
• Product ID
• Sales Dote
• Sales Amount
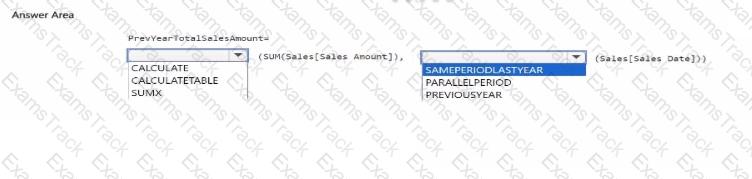
You need to create a DAX measure that will return the total sales amount for the same dates from the previous year. How should you complete the measure? To answer, select the appropriate options m the answer area.
NOTE: Each correct selection is worth one point.
A business intelligence (Bl) developer creates a dataflow in Power Bl that uses DirectQuery to access tables from an on premises Microsoft SQL server. The Enhanced Dataflows Compute Engine is turned on for the dataflow.
You need to use the dataflow in a report. The solution must meet the following requirements:
• Minimize online processing operations.
• Minimize calculation times and render times for visuals.
• include data from the current year, up to and including the previous day.
What should you do?
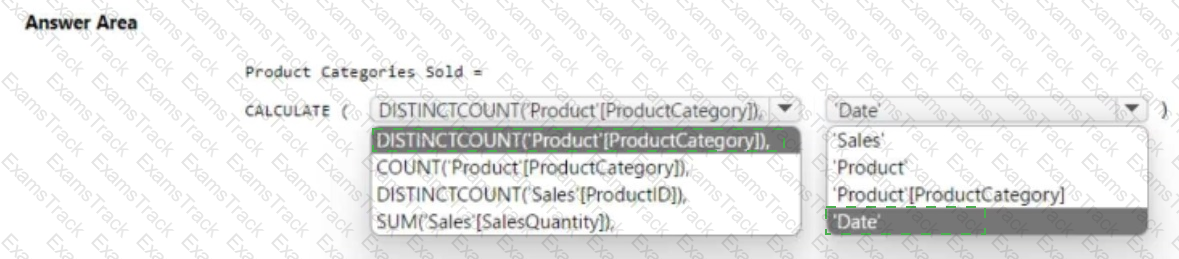
You have the Power Bl data model shown in the following exhibit.
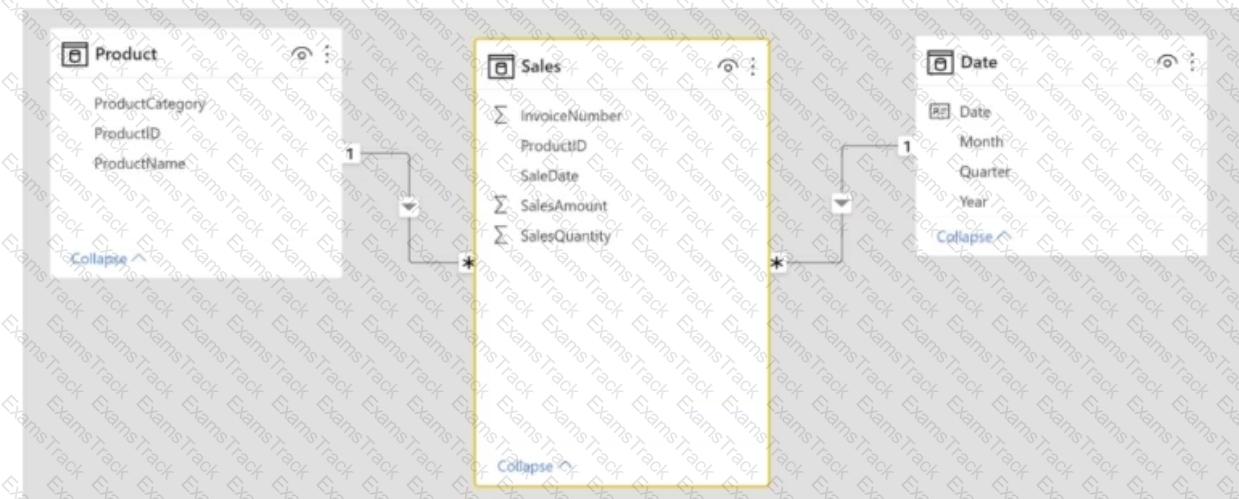
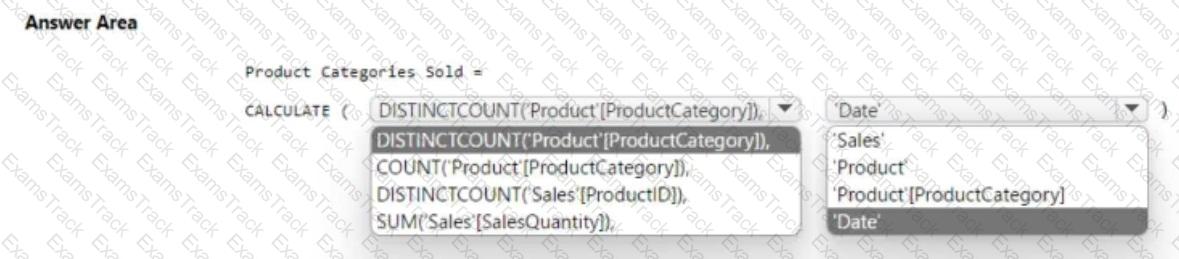
You need to create a measure to count the number of product categories that had products sold during a selected period. How should you complete the DAX expression? To answer, select the appropriate options in the answer area. NOTE: Each correct selection is worth one point.
You have a Power Bi model mat contains a table named Date. The Date table contains the fallowing columns:
• Date
• Fiscal year
• Fiscal Quartet
• Month Name
• Calendar Year
• Week Number
• Month Number
• Calendar Quarter
You need to create a calculated table based on the Date table. The calculated tab*e must contain only unique combinations of values for Calendar Year. Calendar Quarter and Calendar Month. Which DAX function should you include in the table deflation?
Note: This question is part of a series of questions that present the same scenario. Each question in the series contains a unique solution that might meet the stated goals. Some question sets might have more than one correct solution, while others might not have a correct solution.
After you answer a question in this section, you will NOT be able to return to it. As a result, these questions will not appear in the review screen.
You are modeling data by using Microsoft Power Bl. Part of the data model is a large Microsoft SQL Server table named Order that has more than 100 million records.
During the development process, you need to import a sample of the data from the Order table.
Solution: You add a report-level filter that filters based on the order date.
Does this meet the goal?
You publish a report to a workspace named Customer Services. The report identifies customers that have potential data quality issues that must be investigated by the customer services department of your company.
You need to ensure that customer service managers can create task lists in Microsoft Excel based on the data.
Which report setting should you configure?
You have a Power Bl report that contains the visual shown in the following exhibit.
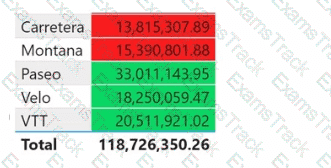
You need to make the visual more accessible to users who have color vision deficiency.
What should you do?
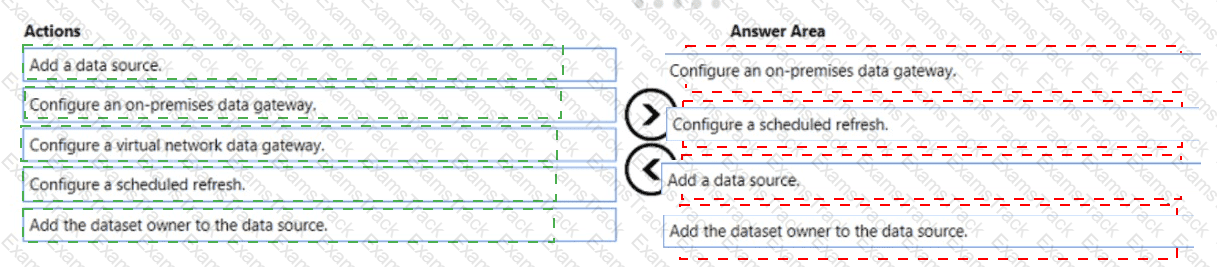
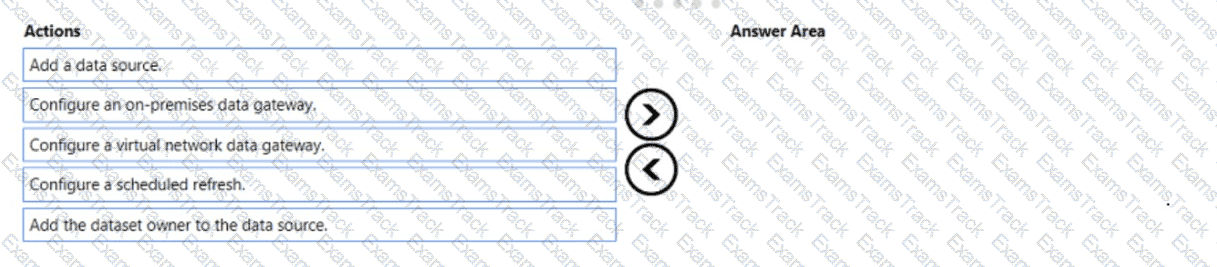
You publish a dataset that contains data from an on-premises Microsoft SQL Server database.
The dataset must be refreshed daily.
You need to ensure that the Power BI service can connect to the database and refresh the dataset.
Which four actions should you perform in sequence? To answer, move the appropriate actions from the list of actions to the answer area and arrange them in the correct
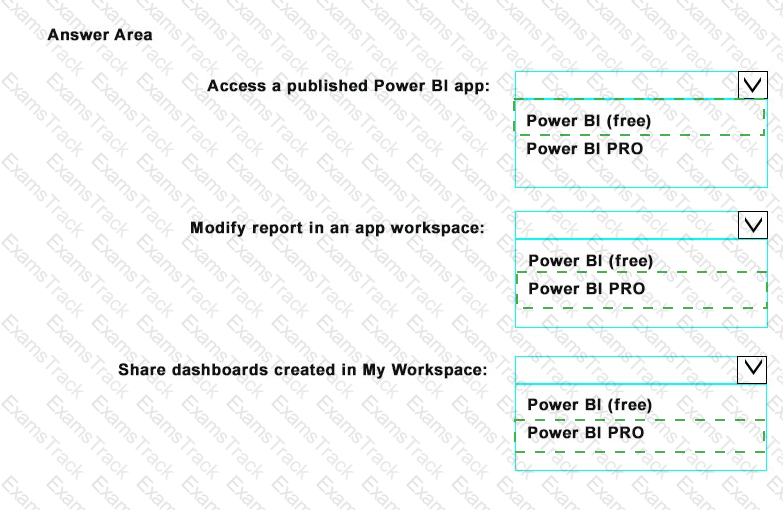
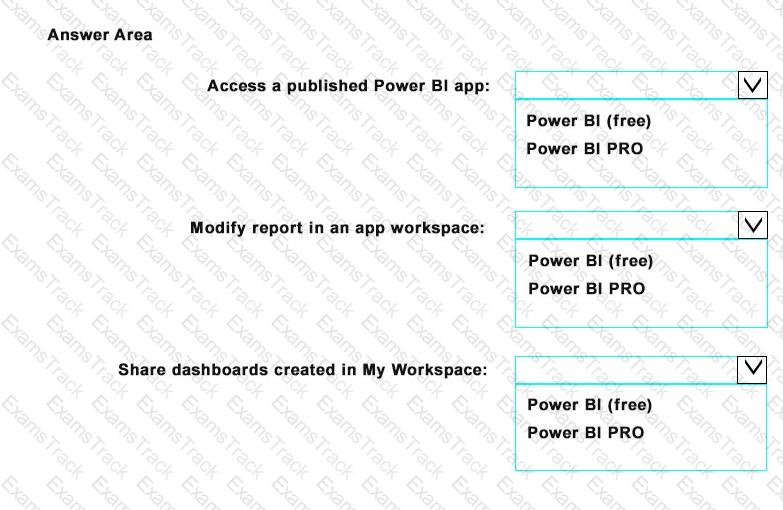
Your company plans to use Power BI for 20 users in the sales department. The users will perform the following tasks:
Access a published Power BI app
Modify reports in an app workspace
Share dashboards created in My Workspace
You need to identify which Power BI licenses are required for the tasks. The solution must use the Power BI (free) licenses, whenever possible.
Which license should you identify for each task? To answer, select the appropriate options in the answer area.
NOTE: Each correct selection is worth one point.
|
PDF + Testing Engine
|
|---|
|
$52.5 |
|
Testing Engine
|
|---|
|
$40.5 |
|
PDF (Q&A)
|
|---|
|
$34.5 |
Microsoft Free Exams |
|---|

|
Copyright © 2026 Examstrack. All Rights Reserved

TESTED 07 Jul 2026