You need to recommend a strategy to consistently define the business unit, department, and product category data and make the data usable across reports.
What should you recommend?
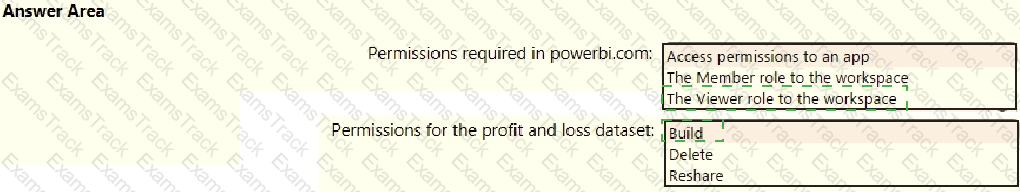
How should you distribute the reports to the board? To answer, select the appropriate options in the answer area.
NOTE: Each correct selection is worth one point.
Which DAX expression should you use to get the ending balances in the balance sheet reports?
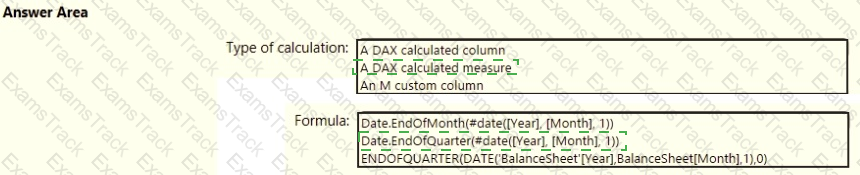
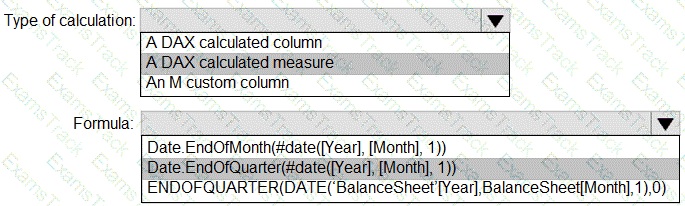
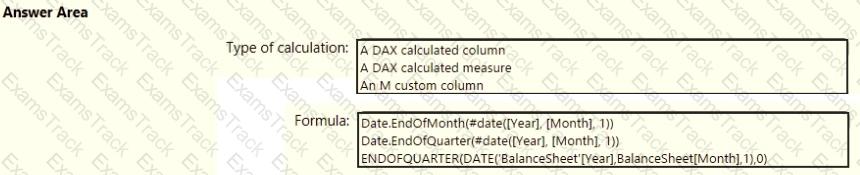
You need to calculate the last day of the month in the balance sheet data to ensure that you can relate the balance sheet data to the Date table. Which type of calculation and which formula should you use? To answer, select the appropriate options in the answer area. NOTE: Each correct selection is worth one point.
What is the minimum number of datasets and storage modes required to support the reports?
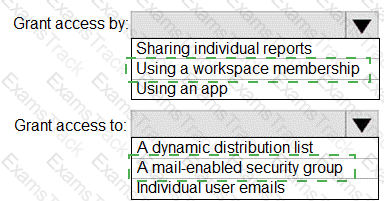
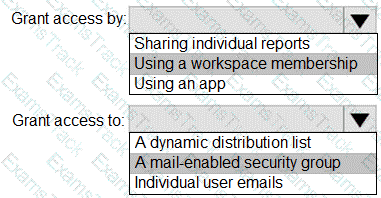
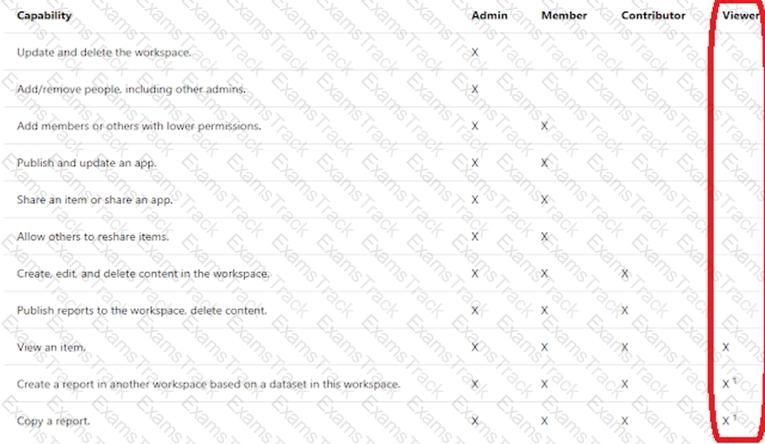
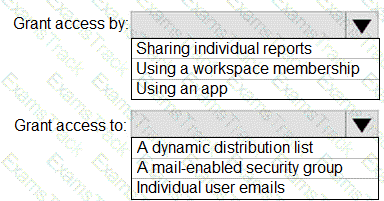
You need to grant access to the business unit analysts.
What should you configure? To answer, select the appropriate options in the answer area.
NOTE: Each correct selection is worth one point.

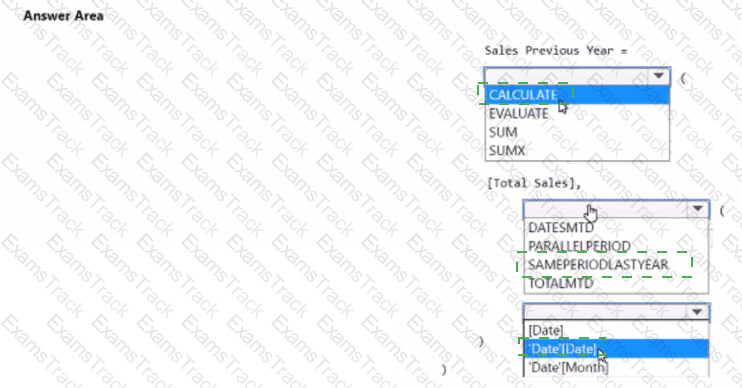
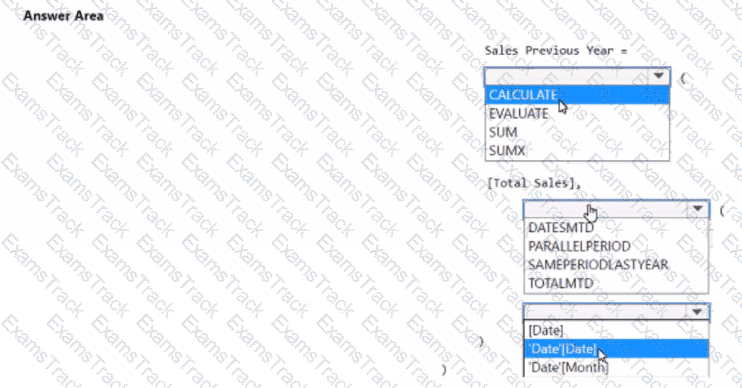
You have a Power BI model that contains a table named Sales and a related date table. Sales contains a measure named Total Sales You need to create a measure that calculates the total sales from the equivalent month of the previous year.
How should you complete the calculation? To answer, select the appropriate options in the answer area
NOTE: Each correct selection is worth one point.
You need to create relationships to meet the reporting requirements of the customer service department.
What should you create?
You need to create a relationship between the Weekly_Returns table and the Date table to meet the reporting requirements of the regional managers. What should you do?
You merge data from Sales.Region, Region_Manager, Sales_Manager, and Manager into a single table named Region. What should you do next to meet the reporting requirements of the executives?
|
PDF + Testing Engine
|
|---|
|
$52.5 |
|
Testing Engine
|
|---|
|
$40.5 |
|
PDF (Q&A)
|
|---|
|
$34.5 |
Microsoft Free Exams |
|---|

|
Copyright © 2026 Examstrack. All Rights Reserved

TESTED 06 Jul 2026