When one team member eagerly answers questions and offers multiple ideas during a meeting, the facilitator should take which of the following actions to balance participation by the other team members?
When input variables are held constant and variation occurs in the response variable, the condition is referred to as
Which of the following tools should be used to identify the source of a performance gap?
Which of the following tools is used to improve product development, order-processing, and production activities on an ongoing basis?
Which of the following actions will support design for manufacturability (DFM)?
A Six Sigma team is reviewing the following data from a 2-sample t-test on Unit 1 and Unit 2 of a product. Variances are not assumed to be equal.
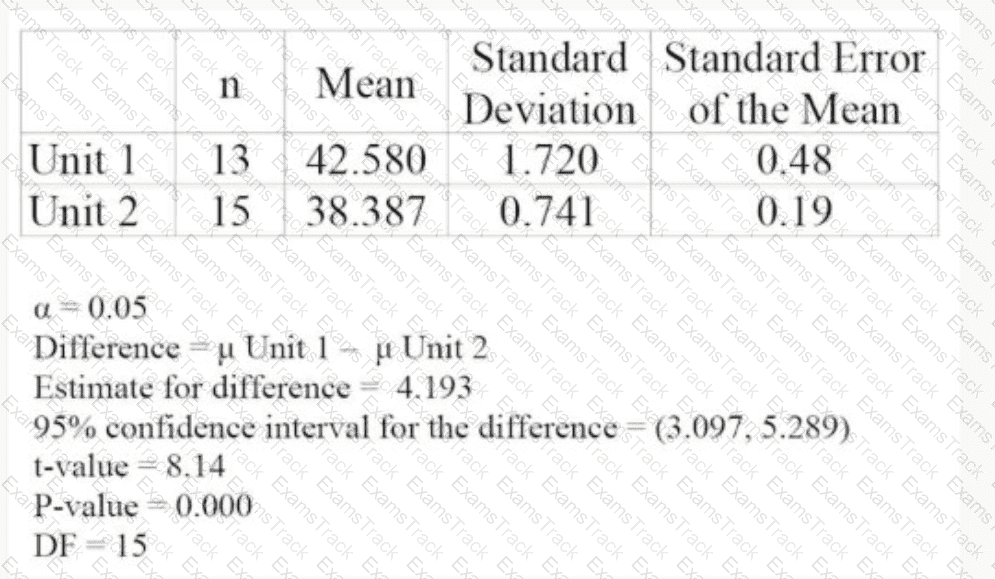
On the basis of this information below, which of the following conclusions would be appropriate to draw from this test?
Using standard work will help increase
Which of the following groups of people should be included in the communication plan for a Six Sigma project that is just being started?
A bottle-filling operation is required to fill glass bottles with 16–17 ounces per fill. Fill levels are normally distributed. When a customer requested a process capability study, the company sampled 4 bottles every half hour over five 8-hour shifts. The mean fill level for this sample was X̄ = 16.4 and the fill range was 15.9–16.8 with R̄ = 0.6. What is the short-term process capability index for this process?
In a Lean Six Sigma environment, the concept of lessons learned is used to
|
PDF + Testing Engine
|
|---|
|
$49.5 |
|
Testing Engine
|
|---|
|
$37.5 |
|
PDF (Q&A)
|
|---|
|
$31.5 |
ASQ Free Exams |
|---|

|
Copyright © 2026 Examstrack. All Rights Reserved

TESTED 12 Jul 2026
