A Data Analyst has a workbook that uses an extracted data source.
The analyst publishes the workbook to Tableau Server.
Which three actions can the analyst perform from the Extract Refresh page in Tableau Server? (Choose three.)
A Data Analyst has a data source that contains data for every city in the United States. The following is a sample of the data.
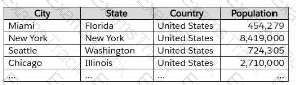
The analyst needs to use the City dimension to create a dynamic filter that shows the cities that have a population greater than 1 million.
Which type of filter should the analyst use?
You have a dashboard that is configured for desktop browsers.
You want to customize a layout for mobile users.
Which option should you select first? (Click the appropriate Option in the Answer Area.)
You have the following chart that sorts states by the number of products each state has purchased.
Which formula should you use to include a number with the position of each state within each region?
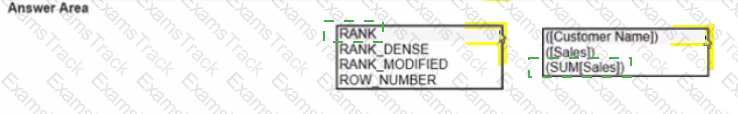
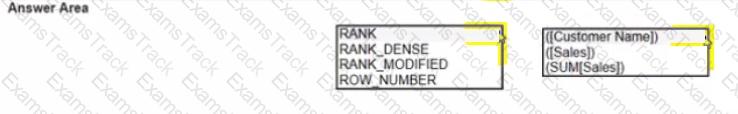
You have the following dataset.
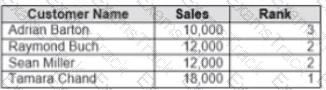
Yon need to calculate the ranking shown in the Rank field.
How should you complete the formula? (Use the dropdowns in the Answer Area to select the correct options to complete the formula ?
You have the following box plot that shows the distribution of average profits made in every state by region.
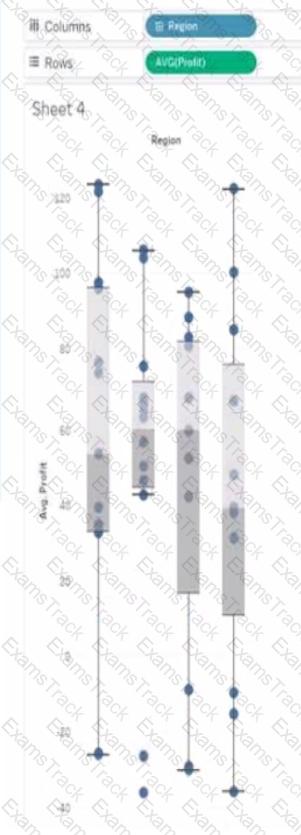
Which region has the smallest distribution of profits?
When a Data Analyst needs to format workbook settings, which options are available in the Format Workbook panel?
A Data Analyst is using containers on a dashboard.
How should the analyst make sure multiple objects within a container are always taking up the same width or height, even if the container is resized?
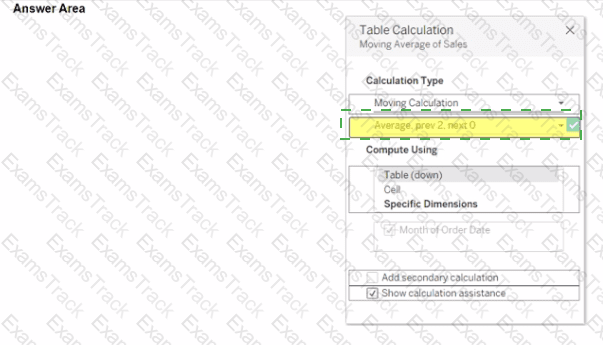
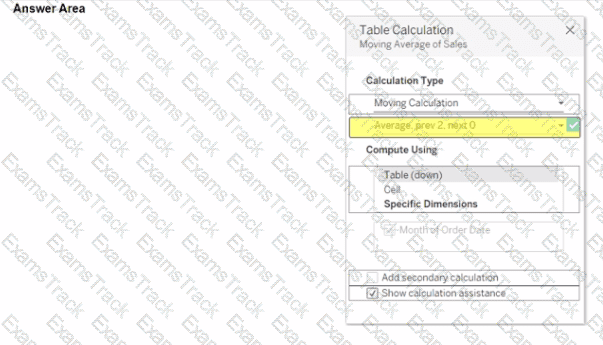
You use a quick table calculation lo calculate the moving average of a measure named Sales.
You need to calculate the moving averages of the last three years.
Which setting should you change in the Table Calculation dialog box? {Click the appropriate Option in the Answer Area)
You want to create the following dashboard.
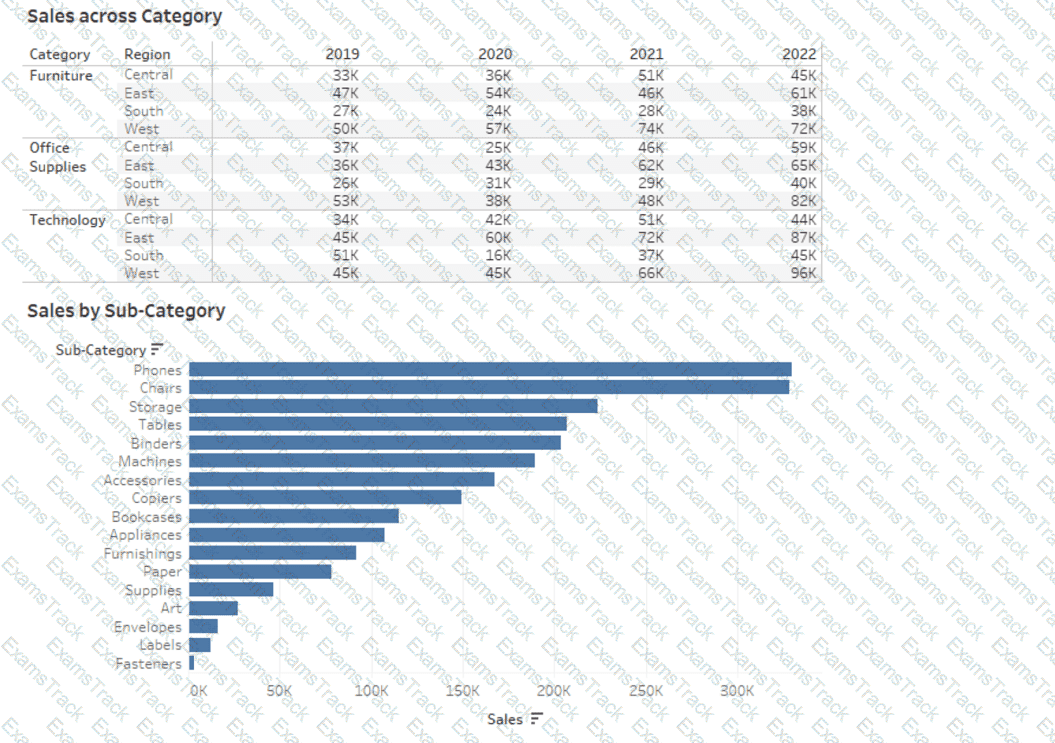
The dashboard will contain two sheets that will connect to the same data source. The top sheet will be configured to filter the bottom sheet.
When you click a category on the top sheet, the sheets must resize as shown in the following exhibit.
How should you lay out the objects on the dashboard?
|
PDF + Testing Engine
|
|---|
|
$49.5 |
|
Testing Engine
|
|---|
|
$37.5 |
|
PDF (Q&A)
|
|---|
|
$31.5 |
Tableau Free Exams |
|---|

|
Copyright © 2026 Examstrack. All Rights Reserved

TESTED 06 Jul 2026