What should a Data Analyst use to visualize the distribution and variability of measure values along an axis?
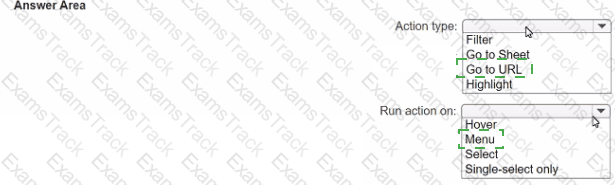
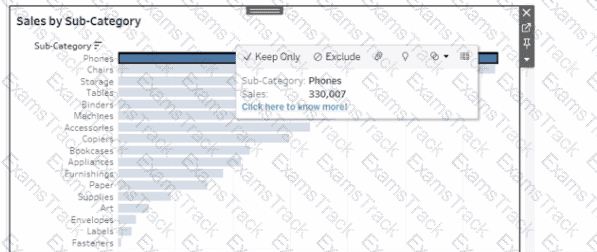
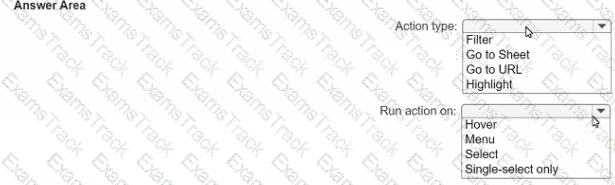
You want to ensure that when you click a bar on a dashboard, a tooltip appears that contains a link named "Click here to know more!" as shown in the following exhibit.
You have the following dataset.
Which grouping option should you use m Tableau Prep to group al five names automatically?
You have a workbook that uses an extracted data source.
You publish the workbook to Tableau Server.
Which three actions can you perform from the Extract Refresh page in Tableau Server? Choose three.
You have the following two tables.
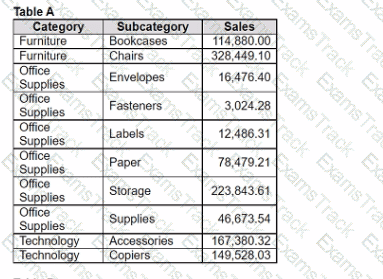
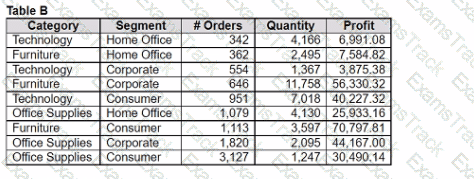
Table A is the primary table.
Which type of join is established when a blend is created by using the join key of Category?
You have the following dataset.
You want to create a new calculated dimension field named Category that meets the following conditions:
. When Subject is Computer Science or Science, Category must be Sciences.
. When Subject is English or Social Studies, Category must be Humanities.
Which two logical functions achieve the goal? Choose two.
You have two tables named Employeelnfo and DepartmentInfo. Employeelnfo contains four fields named Full Name, Department ID, Start Date, and Salary.
DepartmentInfo contains four fields named Department Name, Size, Department ID, and VP.
You want to combine the tables to meet the following requirements:
. Each record in Employeelnfo must be retained in the combined table.
. The records must contain the Department Name, Size, and VP fields.
· Every record must have a full name.
Which type of join should you use?
A Data Analyst is creating a new dashboard.
The analyst needs to add a button to the dashboard that allows users to export the dashboard as an image.
Which type of object should the analyst use?
A Data Analyst is creating an annual report in Microsoft Word.
In Tableau Desktop, the analyst built a chart in a worksheet.
The analyst wants to create an image of the chart to add to the annual report.
Which two options should the analyst use to create the image? (Choose two.)
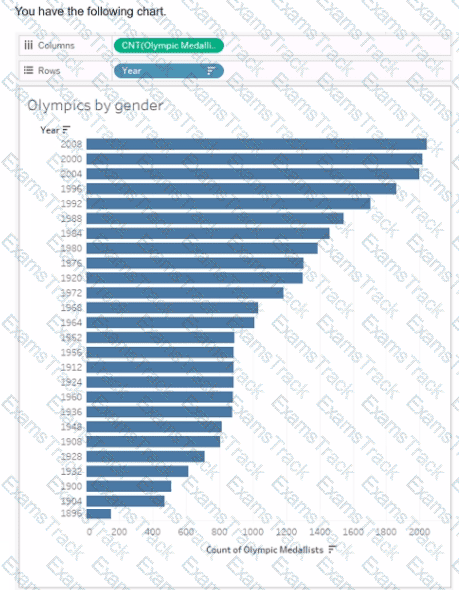
You need the top 10 values to appear in a different color. The lop 10 values must be colored dynamically.
What should you do?
|
PDF + Testing Engine
|
|---|
|
$49.5 |
|
Testing Engine
|
|---|
|
$37.5 |
|
PDF (Q&A)
|
|---|
|
$31.5 |
Tableau Free Exams |
|---|

|
Copyright © 2026 Examstrack. All Rights Reserved

TESTED 06 Jul 2026