When you create a table report with filter groups, what is the logical relationship between filter groups?
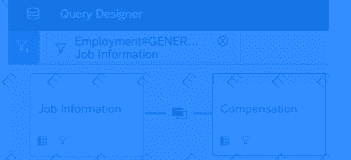
You want to create a query that shows only the current Job Information data for each employee. On the Job Information table, which date type configurations can you use? Note: There are 2 correct answers to this question.
You create a report page and want to change the grid column width and grid row height of the Page Designer. Where can you do this?
You are creating a query that lists employee information such as name, address, and dependent information. The query uses Personal Information as the driving table and joins the Dependents and Address tables. You notice many employees are missing from the result set. What are the reasons?
When you format a list report component, which actions can you perform? Note: There are 3 correct answers to this question.
In addition to any chart filter you may have applied to your chart, which other filters may be affecting the chart filter, due to the Cascading effect in a Story? Note: There are 2 correct answers to this question.
You want to join two tables, A and B, and you want to include all rows from Table A, and only matching rows from Table B. Which join type must you use?
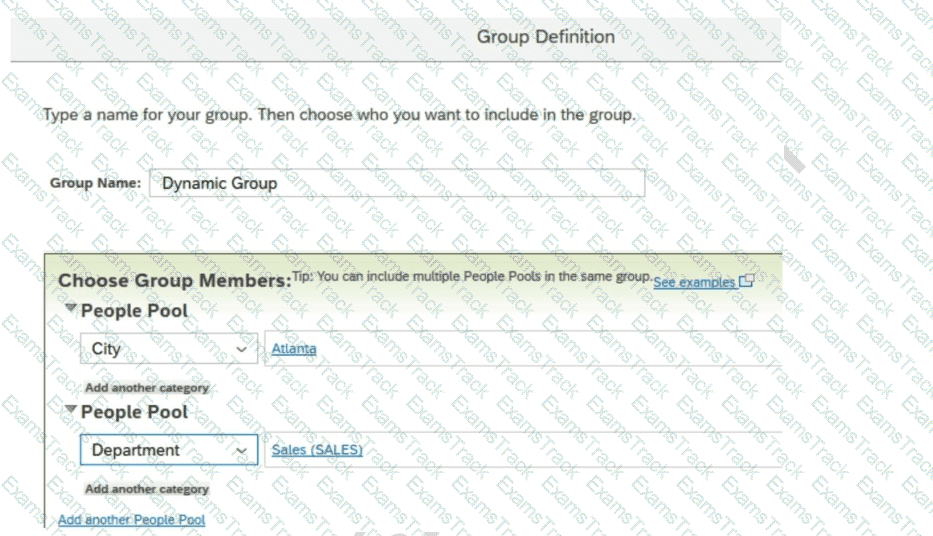
You are using Report Center to share a canvas report. You share the report with a Dynamic Group (see attached image). Who is the report shared with?
You need to create a chart of type Indicator: Numeric Point that displays the following output:
count of employees with the gender male divided by the count of employee with the gender female.
The chart can then be filtered for different departments. What calculation is required to create the metric?
What permission type applied to table reports is defined by a combination of the user's View permissions and Target Population in role-based permissions?
|
PDF + Testing Engine
|
|---|
|
$66 |
|
Testing Engine
|
|---|
|
$50 |
|
PDF (Q&A)
|
|---|
|
$42 |
SAP Free Exams |
|---|

|
Copyright © 2025 Examstrack. All Rights Reserved

TESTED 12 Sep 2025
